
Onboarding metrics are the flight instruments of your organization: without them, you’re flying blind while a new hire quietly decides whether to stay or go. And that decision happens sooner than most leaders expect: new hires typically make up their minds about their job within the first 90 days.
As an HR professional, I’ve seen exactly what that costs. Teams pour huge amounts of money into recruitment only to lose that talent within six months because the onboarding fell flat, and no one caught it in time, because no one was measuring it. That’s not an accident; it’s a blind spot baked into how most HR teams operate. According to McKinsey’s HR Monitor 2025, onboarding metrics remain one of the most underused levers across the entire HR function.
This article is for the moment you decide that onboarding metrics are an immediate necessity, not a distant future. By the end, you’ll know which onboarding metrics matter, how to measure them, and how to use those insights to build a system that prepares new hires to succeed.
What Onboarding Metrics Are and What They Actually Measure
The Basic Definition
Onboarding metrics are the data points that tell you how well new hires are settling in, learning their role, and becoming productive members of the team. Think of them as a diagnostic tool for your people process: the equivalent of a health check during a new hire’s first weeks on the job.
When tracked consistently, these data points connect the experience of the first few weeks directly to long-term performance, manager relationships, and whether a person stays with the organisation beyond their first year. They are not a substitute for good management, but they do give you the visibility to ask better questions and intervene at the right moment.
Why They Matter for Employee Success
Weak onboarding does not just make the first week awkward. It creates problems that show up months later: in performance reviews, in low engagement scores, in avoidable resignations. are significantly more likely to disengage.
Good onboarding metrics give you the early-warning signals. For example, a completion rate drop in week two can tell you something is broken before it becomes a six-month performance problem. A low confidence score in the first survey tells you a new hire needs more support before they fall too far behind to catch up.
The data does not just describe what happened. It helps you intervene at the right moment.
What Good Onboarding Metrics Do Not Do
Let me be clear about something: metrics are a guide, not a verdict. A completion rate of 95% does not mean every new hire is thriving. A low 30-day survey score does not necessarily mean the role is wrong. Numbers tell you where to look; they do not replace the judgement of a good manager who actually knows the person.
Also, a metric alone will never capture the full employee experience. Use the data to ask better questions, not to close the conversation.

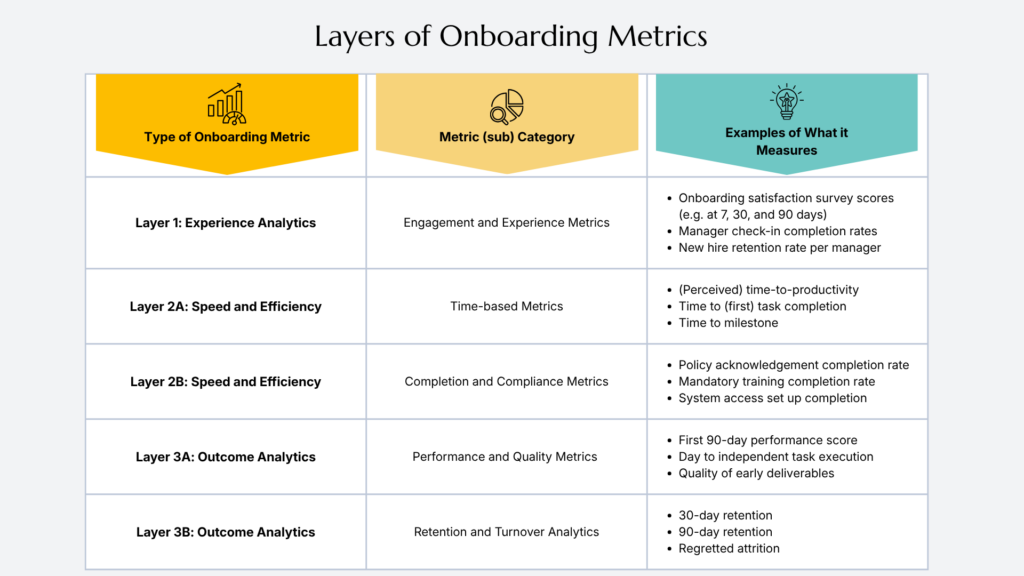
The Three Layers of Onboarding Metrics
One of the most useful ways to organise your onboarding metrics is to think in three distinct layers. The three layers exist because onboarding success unfolds in a sequence:
- Layer 1: Experience Metrics (leading) — These metrics capture what happens earliest in onboarding: how a new hire feels, whether they feel supported, and whether their first impressions create clarity and connection. They predict engagement before performance issues appear.
- Layer 2: Speed & Efficiency Metrics (operational) — These metrics show how smoothly and efficiently the onboarding process runs day‑to‑day. They reveal bottlenecks, delays, and friction points that slow down a new hire’s ability to become capable and independent.
- Layer 3: Outcome Metrics (lagging) — These metrics reflect the longer‑term results of onboarding: performance, quality of work, and retention. They confirm whether the onboarding experience actually translated into success.
Layer 1: Experience Metrics — Engagement and Sentiment
This layer answers the question: How does the new hire feel, and do they feel supported?
Experience metrics include onboarding survey scores, manager check-in completion rates, early employee sentiment, and open-text feedback. These are your leading indicators: the signals that tell you whether the emotional and relational side of onboarding is working before the problems show up in performance.
If no one is asking them how they feel about the first few weeks, they will draw their own conclusions, often quietly, and perhaps incorrectly. Experience metrics fix that gap.
Types of Engagement and Sentiment Metrics
Here are three examples of engagement and sentiment metrics that reveal how a new hire feels during their first period:
- Onboarding satisfaction survey scores (at 7, 30, and 90 days)
- Manager check-in completion rates
- New hire retention rate per manager
Below are several examples questions for a new hire survey that reveal new hire sentiment and engagement, that would otherwise stay invisible until they become problems.
- “How clear are you on what success looks like in your first 90 days?”
- “Do you feel like you have the support you need from your manager?”
- “How valued do you feel at work?”
- “How welcomed do you feel in the company?”
- “How proud are you to work for this company?”
Layer 2: Speed and Efficiency Metrics
This layer answers the question: How fast is the new hire becoming capable and independent?
Speed metrics can be divided in two categories: time-based metrics and compliance and completion metrics. They include time to productivity, time to first task completion, training module completion rates, system setup time, and time to role milestones. These are your operational health checks — the measures that reveal whether the onboarding process itself is efficient or full of unnecessary friction.
If it takes a new hire three weeks to get system access that should take three days, that is not a new hire problem. That is a process problem, and speed metrics will show you exactly where the bottleneck sits.
Time-Based Metrics
Time-based metrics show you how quickly a new hire reaches expected output. The core ones to track are:
- (Perceived) Time to productivity: The number of days from start date to the point where the new hire is performing at the expected level for their role
- Time to (first) task completion: When does the new hire complete (their first) meaningful piece(s) of work?
- Time to milestone: How long does it take to hit specific, role-defined milestones?
(Perceived) Time to Productivity
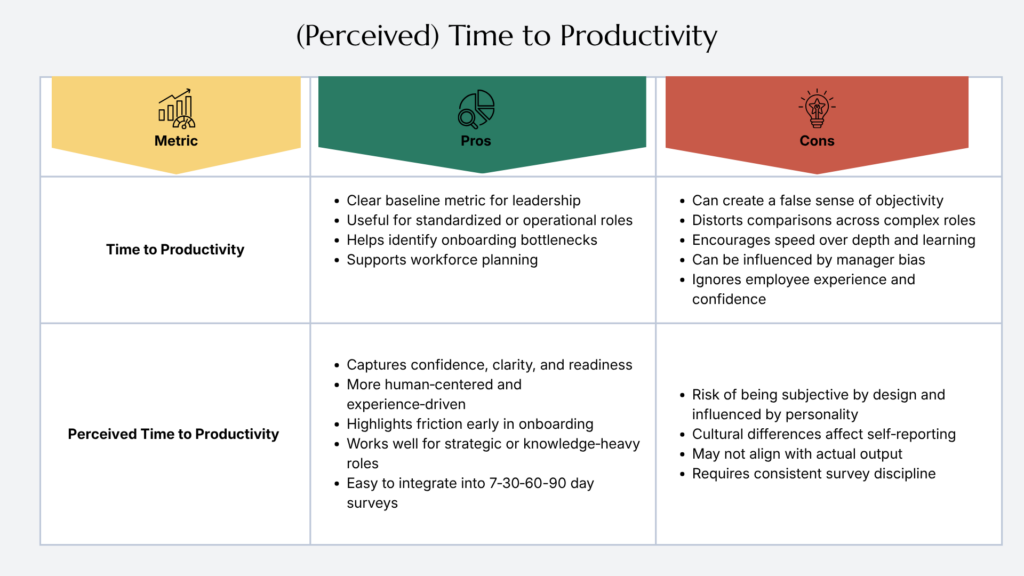
Measuring time to productivity seems straightforward, but the core issue is that productivity is rarely an objective stopwatch metric. Every manager, team, and role defines “productive” differently, which makes the number look precise while possibly hiding subjectivity. It also risks over‑emphasizing speed, encouraging new hires to rush through onboarding instead of building sustainable, high‑quality performance.
Therefore, it is wise to complement it with perceived time to productivity, which captures how quickly both the new hire and the manager feel the person is contributing meaningfully. This perception‑based measure is more human‑centered and highlights friction early, especially in complex or knowledge‑heavy roles.
However, you do need enough consistent input before you can measure time to productivity at all — clear expectations, defined milestones, and early work to assess. Many teams don’t have that foundation, which makes the metric difficult to use reliably.
That’s why some organisations rely on perceived time to productivity on its own. It captures how quickly both the new hire and the manager feel the person is contributing meaningfully, which makes it useful when objective data is limited. You just need to stay mindful of its downsides: it can be subjective, influenced by confidence levels, personality, and cultural norms around self‑reporting.
Used together, the two metrics give a fuller picture: operational readiness on one side (time-to-productivity), and confidence, clarity, and experience on the other (perceived-time-to-productivity).
Time to (first) task completion
Time to (first) task completion measures how quickly a new hire delivers their first meaningful, productivity‑contributing piece of work. It shows the moment they shift from onboarding activities to actual output, making it one of the earliest indicators of whether they’re ramping up at a healthy pace.
Because it reflects both the new hire’s readiness and the efficiency of your onboarding process, it helps you understand how quickly someone is moving toward full productivity.
Time to Milestones
Milestones will look different depending on the function. In sales, that might be completing the first discovery call or submitting the first qualified lead. In customer support, it might be resolving a ticket independently. In operations, it might be running a process without supervision. In knowledge work, it might be delivering a first draft or completing a project phase.
Define your milestones before you hire, not after. Undefined milestones are a recipe for frustration, because the new hire who does not know what success looks like, and the manager can’t tell whether the person is on track.
Completion and Compliance Metrics
These metrics track whether new hires have completed the forms, training modules, policy reviews, and system setup steps required for them to perform the job well.
- Policy Acknowledgement Completion Rate
- Mandatory Training Completion Rate
- System Access Setup Completion
Completion and compliance metrics matter early, particularly in regulated industries or roles with access dependencies. If a new hire cannot use the primary system because their access request was never approved, their time-to-productivity number is not a reflection of their capability. It is a reflection of process failure.
Use these metrics to surface broken workflows quickly. Common signals include:
- A high rate of incomplete policy acknowledgements
- Slow IT setup times
- Missing role-specific compliance steps (often the result of a generic checklist that does not account for role differences)
Layer 3: Outcome Metrics
This layer answers the question: Did onboarding actually work?
Outcome metrics show whether the experience you designed in earlier layers translated into real performance, quality, and retention results. These are lagging indicators — essential for evaluating the system over time, but too late to fix issues for the individual who already struggled or left. That’s why outcome metrics must be paired with experience and speed metrics from the earlier layers.
Outcome metrics fall into two categories: performance and quality metrics and retention and turnover metrics.
Performance and Quality Metrics
These metrics show how effectively a new hire performs once they begin contributing. They reveal whether onboarding equipped them with the clarity, skills, and support needed to do their job well.
Three core performance and quality metrics:
- First‑90‑day performance score — early assessment of role mastery, clarity, and execution.
- Days to independent task execution — measures how long it takes to work independently.
- Quality of early deliverables — evaluates whether work meets expected standards in accuracy, completeness, and professionalism.
Early performance signals vary by role. For a sales hire, they might include pipeline quality and call‑conversion rates. For a support hire, they might include first‑contact resolution and customer satisfaction scores. For a technical hire, they might include code‑review feedback or the complexity of tickets they can handle.
Use these metrics to catch readiness issues before they escalate. When a new hire repeatedly makes the same type of mistake in the first 60 days, it signals something deeper: incomplete training, unclear expectations, or a need for a different type of support. Identifying this at day 60 is far more effective than discovering it during a formal review six months later.
Retention and Turnover Metrics
Retention metrics provide the clearest long‑term signal of onboarding effectiveness. They show whether new hires stay, settle in, and feel committed — or whether something in the early experience pushed them away. Here are three core retention and turnover metrics:
- 30‑day retention — indicates whether new hires make it through the initial adjustment period.
- 90‑day retention — shows whether they remain after forming a first impression of the role, team, and manager.
- Regretted attrition / turnover — identifies early exits the organisation would have preferred to prevent.
When someone leaves within the first 90 days, do not assume it was a hiring mistake. Exit data often reveals deeper causes: unclear expectations, insufficient support, poor manager relationships, or misalignment between the role and what was promised. Distinguishing between onboarding‑related exits and issues tied to role fit or compensation is essential — each requires a different solution.
How to Measure Onboarding Metrics Correctly
Set a Clear Baseline
Before you can judge whether your onboarding is improving, you need a starting point. If you have historical data, use it. If you do not, run a pilot cohort and treat their results as your baseline. Without a reference point, you cannot tell the difference between a good score and a great one — or between a stable result and a warning sign.
Define Each Onboarding Metric in Plain Terms
Vague definitions produce unreliable data, so each metric needs to be described in language that any manager can apply consistently. Time‑to‑productivity, for example, means very little unless you’ve defined what “productive” looks like for that specific role.
The goal isn’t to over‑engineer the process, but to create shared clarity: what counts, how it’s measured, and who is responsible for the data. When definitions differ from one manager to another, the results become impossible to compare.
One person may consider onboarding complete when the HR checklist is finished, while another waits until role‑specific training and the first independent task are done. Clear definitions prevent this drift and ensure your metrics reflect reality rather than interpretation.
Choose the Right Time Frames
Different metrics tell different stories at different points in time.
| Time Frame | Best For |
| 7 days | Compliance and access completion |
| 30 days | Early engagement and clarity scores |
| 60 days | Learning progress and task readiness |
| 90 days | Performance, confidence, and retention risk |
| 6 months | Retention outcomes and long-term engagement |
Do not try to pull performance data at seven days and don’t wait until six months to check in on how the new hire is feeling. Align the time frame to the type of information you are trying to capture.
Common Mistakes When Tracking Onboarding Metrics
Measuring Too Much
More data is not always better data. If you are tracking 25 metrics across the first 90 days, nobody is going to review them all, nobody is going to act on them consistently, and the ones that actually matter will get lost in the noise.
Start with a core set of three to five metrics. You can add supporting data once the core is working. Resist the urge to add every metric that sounds interesting during planning.
Tracking Activity Instead of Progress
Activity metrics are easy to collect, which is exactly why they are overused. Always ask: does this metric tell me whether the new hire is actually becoming more capable, or does it just tell me that they clicked a button?
Fir example, completing a training module is not the same as understanding the content. Attending a check-in meeting is not the same as feeling supported.
If you are tracking activity instead of progress, it is a supporting metric at best — not a core KPI.
Ignoring Manager Behaviour
Managers shape onboarding more than any programme, checklist, or LMS module. Their check-in frequency, the quality of feedback they give, the clarity with which they set expectations: all of these determine whether the new hire succeeds or struggles.
When you ignore manager behaviour in your onboarding data, you misread the results. A team with consistently low onboarding satisfaction scores may not have a bad onboarding programme. They may have a manager who is absent, unclear, or not prioritising new hire support. Track manager check-in completion rates and include manager behaviour as a variable in your analysis.
Using Metrics Without Action
Tracking data without a follow-up plan is a box-ticking exercise that wastes everyone’s time and creates false confidence. If you run an onboarding survey and the scores are low, something needs to happen before the next cohort starts. Examples of simple, immediate responses:
- A low role-clarity score — update the first-week briefing and manager guide
- A long system setup time — escalate to IT and establish a pre-boarding access process
- A high training module abandonment rate — review and shorten the modules
- A low manager check-in rate — set calendar reminders as a default for all new hire managers
Ultimately, data is only as valuable as the decisions it drives
Conclusion
No one shows up on day one wanting to fail, and no company signs an offer letter hoping to replace that person by next quarter. Yet, companies continue to lose great people simply because they lack onboarding metrics and have no visibility into the challenges new hires face.
Fixing this doesn’t require a massive data science team. Just pay attention to three specific layers:
- Layer 1: Experience Metrics (leading) : These metrics capture what happens earliest in onboarding — how a new hire feels, whether they feel supported, and whether their first impressions create clarity and connection.
- Layer 2: Speed & Efficiency Metrics (operational): These metrics show how smoothly the onboarding process runs on a daily basis and how quickly a new employee becomes competent. This allows you to identify bottlenecks and problems before they slow someone down.
- Layer 3: Outcome Metrics (lagging): These metrics reflect the longer‑term results of onboarding — early performance, quality of work, and retention — showing whether the experience you designed actually translated into success.
When you look at onboarding through these three layers, retention becomes something you can actually control. You can start small. Pick one metric from each bucket, define it clearly, and get your managers on board.
Data is never going to replace a great manager or a motivated new hire, but it will give you a heads-up that someone is struggling while you still have time to fix it.
And last, think of these metrics as your organization’s flight instruments. Without them, you are effectively flying blind, completely unaware that a new hire is quietly deciding whether to stay or walk out the door.